Variance
Variance is a measurement of distribution.
Variance measures the dispersion of observations from their mean value (mü). The higher the variance, the more dispersed the observations are from their mean.
Formula in case you have 3 observations :
((observation point 1 – mean) + (observation point 2 – mean) + (observation point 3 – mean))^2 / n (n means number of observations)
Following, you can see two probability distributions. One has a large variance and one a smaller one.
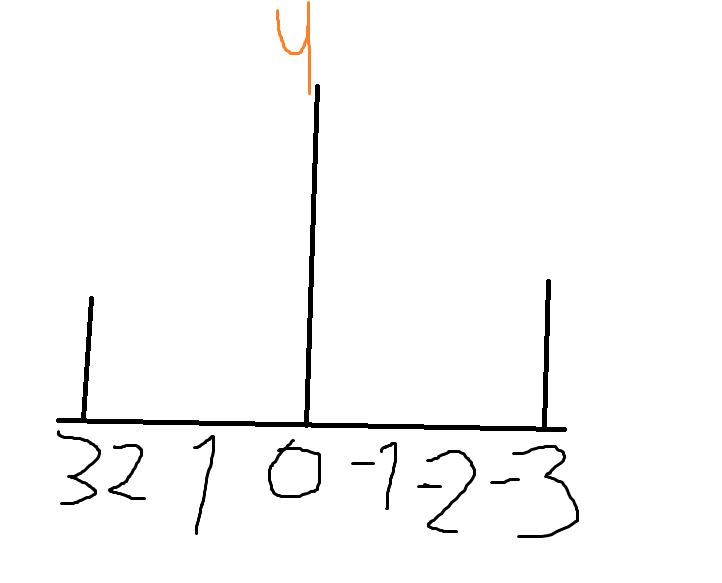
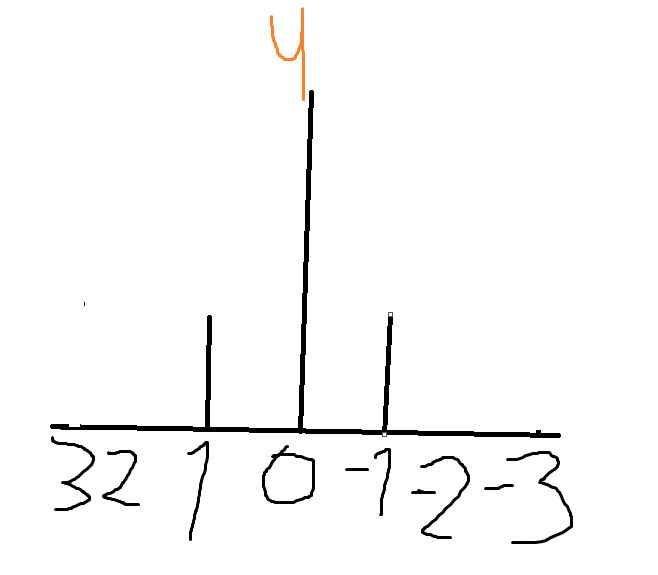
Probably you guessed right. The one on the left (+3/-3) has a larger variance than the one on the right.
In case you don’t analyze the total population, but you analyze just a sample of the whole population, you subtract the number of observations – 1
Formula: (sample values – sample mean) ^ (1 / (n-1))
In case you analyze the total population you dont subtract – 1
Formula: (sample values – sample mean) ^ (1 / n)
Then we square the data cause we only want to use non-negative numbers. If we use our two observations from the first picture ( -1 and + 3 ) to calculate their deviation from their expected value (mü), it becomes clear these two numbers would cancel each other out. However, if we use the squared deviation of the two observations, they become positive.
Lets try:
Mean:
(3+3)/2 = 3 Our mean is 3
2/2 = 1
-1 -1 + 3 – 1 / 2
-2 + 2 / 2 = 0