Data Science

Testing time-series stationarity in python
# -*- coding: utf-8 -*-
"""
Created on Tue Jun 29 13:51:56 2021
@author: Haderer
"""
import os
os.chdir(r"C:\Users\haderer\Desktop\ts")
cwd= os.getcwd()
print("Current working directory is:", cwd)
import pandas as pd
import pandas_datareader
from pandas_datareader import data
import seaborn as sns
from statsmodels.graphics.tsaplots import plot_acf
import numpy as np
from matplotlib import pyplot as plt
from matplotlib.dates import DateFormatter
from statsmodels.tsa.seasonal import seasonal_decompose
from statsmodels.tsa.arima_model import ARIMA
import matplotlib.pyplot as plt
df = pd.read_csv('msciemret.csv', parse_dates=['Date'])
df = df.replace(',','', regex=True)
df['Price'] = df['Price'].astype(float)
print(df['Price'].std())
# convert to datetime
df['Date']= pd.to_datetime(df['Date'], format='%b %y')
df.info()
df = df.set_index('Date')
df.sort_values(by=['Date'], inplace=True)
# Calculate the daily returns and log returns of price
df['Returns'] = df['Price'].pct_change()
df['log return'] = np.log(df['Price']).diff()
df = df.replace(',','', regex=True)
print(df)
df=df.dropna()
print(df.index)
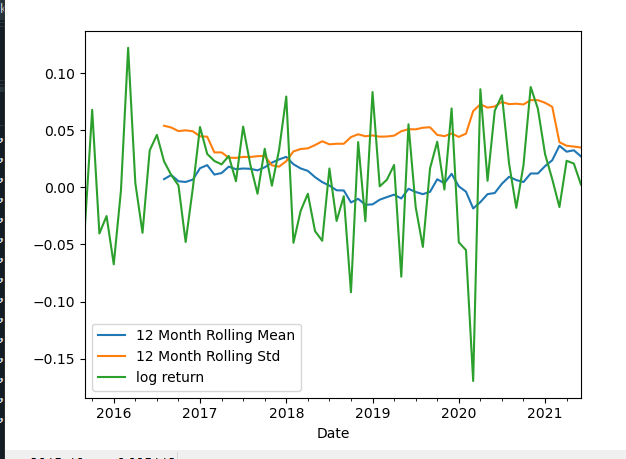
time_series=df['log return']
time_series.rolling(12).mean().plot(label='12 Month Rolling Mean')
time_series.rolling(12).std().plot(label='12 Month Rolling Std')
time_series.plot()
plt.legend()
decomp= seasonal_decompose(time_series)
decomp.plot()
from statsmodels.tsa.stattools import adfuller
def test_stationarity (timeseries):
#roling statistics
movingAverage = timeseries.rolling(window=12).mean()
movingSTD= timeseries.rolling(window=12).std()
orig= plt.plot(timeseries, color='blue',label='Original')
mean= plt.plot(movingAverage,color='red', label='Rolling Mean')
std= plt.plot(movingSTD, color='black', label= 'Rolling STD')
plt.legend(loc='best')
plt.show(block=False)
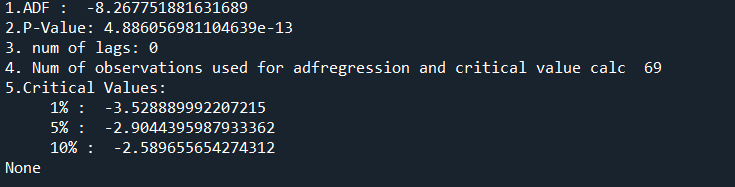
dftest = adfuller(df['log return'], autolag ='AIC')
print("1.ADF : ", dftest[0])
print("2.P-Value:",dftest[1])
print("3. num of lags:", dftest[2])
print("4. Num of observations used for adfregression and critical value calc ",dftest[3])
print("5.Critical Values:")
for key, val in dftest[4].items():
print("\t",key, ": ", val)
print(test_stationarity(df['log return']))
Portfolioflows
0