Linear Regression
By doing a regression try to explain a (dependent) variable by means of a linear function through another (independent) variable. These two variables have a correlation (that is more or less than 0)
Below you see a scatter plot that indicates a correlation between variables X and Y. X could be the returns of the Sample EM Index and Y the returns of the Sample EM Mutual Fund.
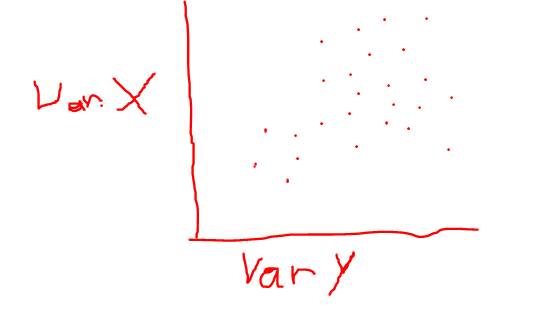
We assume X is the independent variable and Y the dependent variable. We can ask now if the Sample EM Index (X) rises by 1% how much would our Sample EM Fund rise (Y).
To analyze that we use a regression (line)
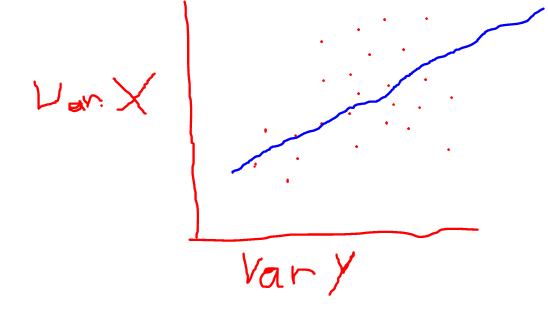
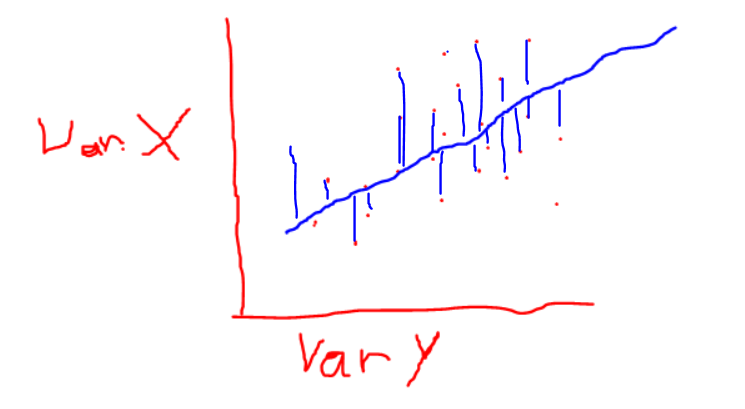
A regression is also called OLS (ordinary least squares) as it minimizes the squared distances between the regression line and the data points.
The regression line is defined by the following formula:
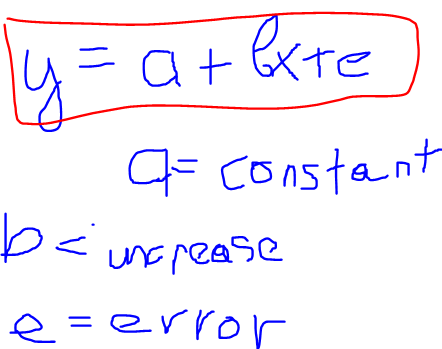
The variable a is the constant. It shows you the value of the dependent variable Y when variable X is 0
The variable b is the inrease of the regression line in case the independent variable X increases.
The variable e is the error.
Example
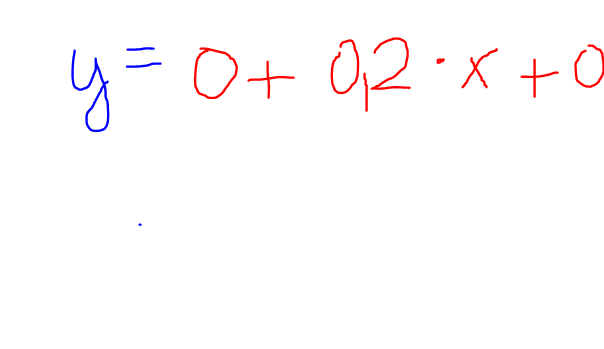
So for example, if the return of x rises by 10% the variable y rises by 2% ( 0,2*0,1)