Frequency – Histogram
If you want to represent a lot of data in one table you could use ways such as a histogram. A histogram separates your data points into groups and shows you how many data points are in each group. Therefore a histogram shows you the relative frequency of data values. Additionally, a histogram is a great tool to look at how the data is distributed (equally, normal, etc.)
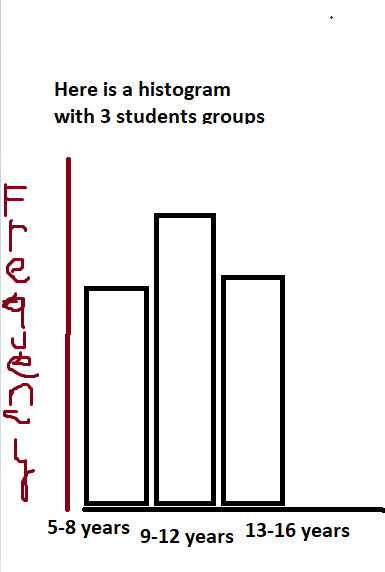
Let’s assume the 4-8-year-old have a frequency of 2. The 9-12-year-old have a frequency of 3 and the 13-16-year-old have a frequency of 2,1.
Now we try to find the mean of the frequency distribution. As there are groups we take the group midpoint of each group.
Formula: Higher value of the group + Lower value devided by 2
1st group: (8+5)/2 = 6,5
2nd group: (12+9)/2 = 10,5
3rd group: (16+13)/2 = 14,5
Formula of the mean: sum of values / number of the values
To calculate the sum of the values: Midpoint x Frequency
6,5 x 2= 13
10,5 x 3= 31,5
14,5 x 2,1 = 30,45
Number of the values = Frequency
(13+31,5+30,45) / 7,1 = 10,55 is the mean
Now we look out for the mode. The mode is the most popular number (in this case group). The most popular (frequent) group is the second one.
Now we look for the median. The meadian is the middle of the number of values (the totoal frequency). So we add the frequencies together:
2+3+2,1 = 7,1 -> Thats the total number of the frequencies.
Now to get the middle just take one half of the total number of frequencies:
7,1 / 2 = 3,55 this indicates in which group the median is situated
We have 3 groups
First group frequencies (2): 1-2
Second group frequencies (+3): 2,..-5
Third group frequencies: 5,..-7.1
As you can see the median of 3,55 must be somehwere in the second group.
–