Correlation vs Covariance
Correlation
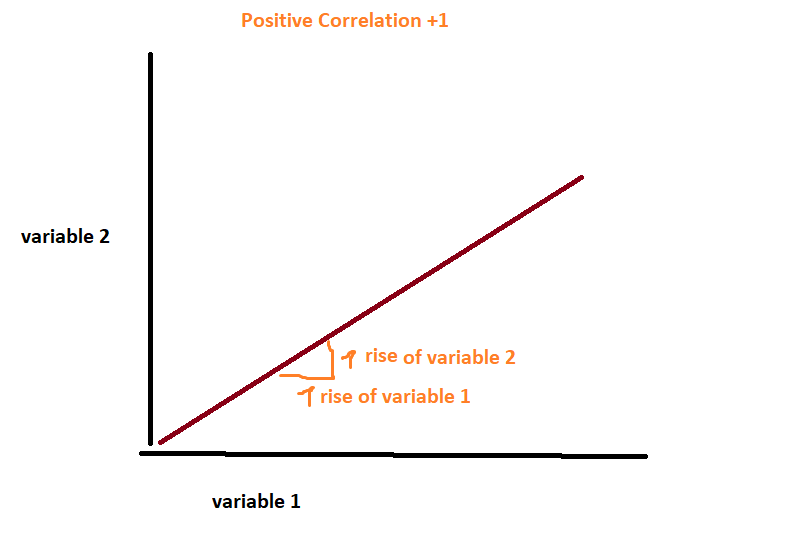
The correlation coefficient shows you the linear relationship (and also the strength of this relationship) between two variables (eg. observations). It can take a value within the range of -1 and +1. Therefore correlation is standardized.
+ 1 suggests a strong positive relationship and -1 suggests a strong negative relationship. So if it is +1 one it means if variable 1 rises at factor 1 the variable 2 also rises at factor 1. A correlation of -1 suggests if eg. variable 1 rise at factor 1 the variable 2 falls at factor 1. A correlation of 0 telly you that the variables are not correlated.
If you calculate the correlation of financial returns you should use the return changes instead of the price data.
The formula of the correlation coefficient is:
( covariance of variable 1 and variable 2) / (standard deviation variable 1 * standard deviation variable 2)
eg. cov(i,j)/ stand(i)*stand(y)
If you calculate for example the correlation of 2 stocks (indices) you should look at the continuous return changes because otherwise even if stocks would be uncorrelated and instead they are both just trending they could have a high correlation.
The best way to look for a correlaton between two variables is a scatter plot.
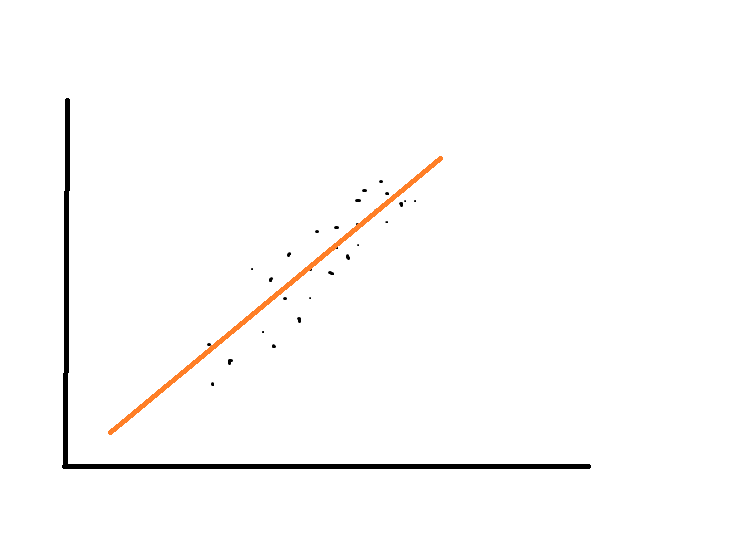
Note: Also non linear data could have a relationship but in that case the correlation coefficient doenst work. However the scatterplot always works to visualize the relationship between two variales.
Facts: The correlation coefficient tells you both the direction (negative, positive) as well as the strength (-1 till +1) of the relationship.
The correlation is always between -1 and +1
Covariance
The covariance tells the direction (negative, positive) of the relationship between two variables. It measures the linear dependence between two variables
Example:
We have 2 Emering Market Stock Indices
| EM Index 1 (monthly average return) | EM Index 2 (monthly average return) |
| 0,01 | 0,02 |
| 0,02 | 0,04 |
| 0,04 | 0,05 |
| 0,05 | 0,05 |
| 0,02 | 0,03 |
| 0,04 | 0,04 |
As can see the returns of the indices are probably (quite strongly) positively “related”. Eg. in this example, usually when the returns of one index move up the returns of the other one also move up.
Let’s look at the formula for the covariance in order to analyze if these two variables are positively related.
cov = ((y-yI)*(x-xI))/(n-1)
First you take value of y minus expectation of y (mean of all y values)
So from each Em1 value (y), you subtract the mean (yI) of all the y values. Then you do the same with the Em2 (x) values.
yI (Mean) = (0,01+0,02+0,04+0,05+0,02+0,04)/6 = 0,16/6= 0,026
0,01-0,026 =-0,016
0,02-0,026 = -0,006
0,04-0,026= 0,014
0,05-0,026= 0,024
0,02-0,026= -0,006
0,04-0,026= 0,014
now same with x
then you take each of these y values * each of these x values
eg. (-0,016*-0,018)+(y2*x2)+… = 0,000808 then you divide it by 11 as there are 12 datapoints (n=12)
Important facts:
The covariance tells just the direction (negative, positive) of the relationship between two variables.
The covariance can take on any number (because that value figure directly depends on the value of the variable you use)