Normal Distribution
Normal distributions
.) Are unimodal – they have one “high” peak
.) Symmetrical shaped – mean mode median are the same
An example for normal distribution would be the size of male students.
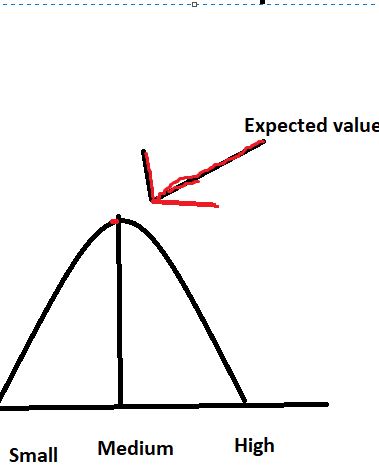
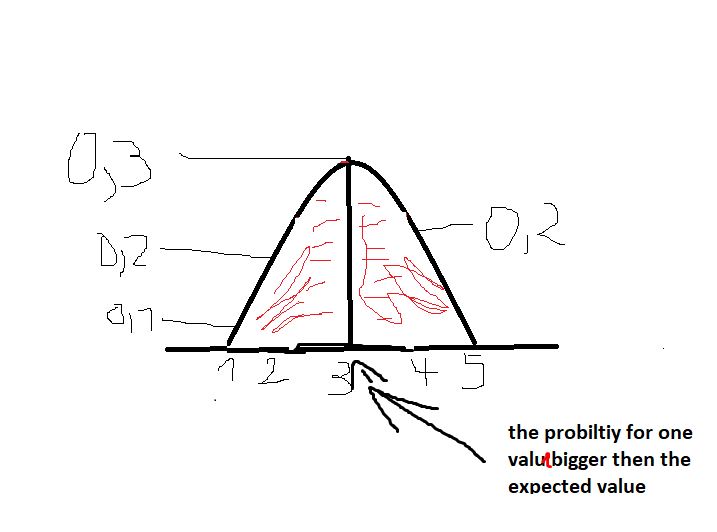
To calculate the expected value, you calculate the weighted mean. -> probability * value (eg size)
Eg. 0,1 * 1 + 0,2 * 2 …
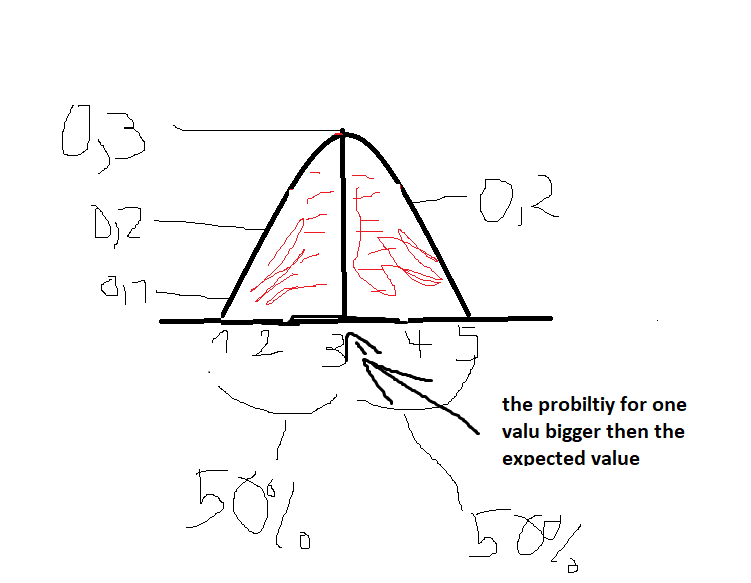
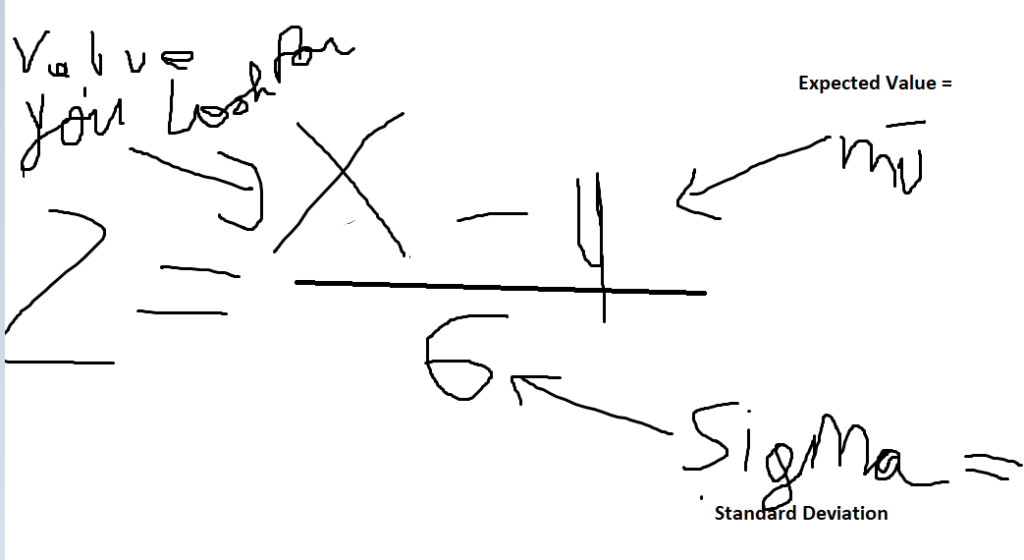
The expected value is also called µ
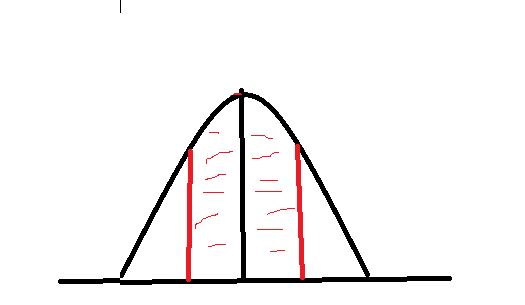
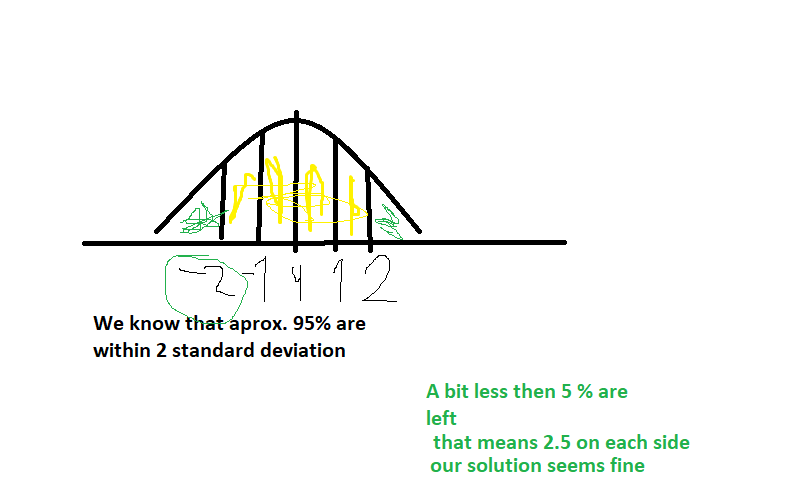
If you look at 2 standard deviations you know that approx 95% of the x values are within that 2 standard deviations.
If you look at 3 standard deviations you know that approx 99% of the x values are within 3 standard deviations.
You have a standard deviation of 10
You have a mü of 100
You have an x of 80
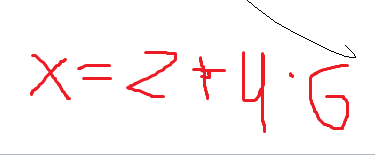
Whats the z score ?
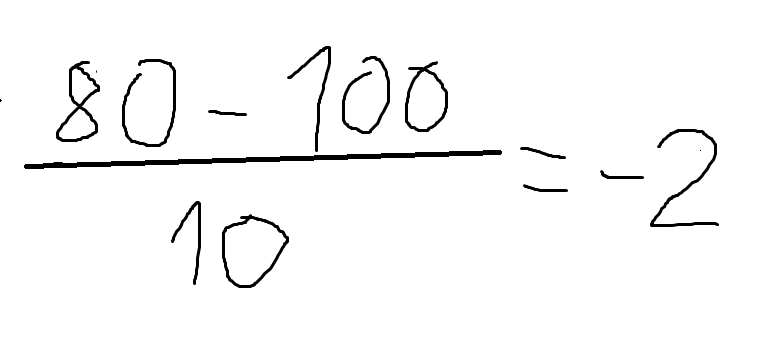
The z score is -2. A z score shows you how far away (measured in standard deviations) from the mü your desired value x is situated. As the z value is negative it means the corresponding x value (80) is below the mean.
Now, look at a Z Table what this Z value corresponds to. It corresponds to 0.02275. Seems logical?